Final-year team project. 2026 to 2027. In progress.
Usine 4.0, in progress, and three personal studies
This year my class runs a team project on the Industry 4.0 smart factory (Usine 4.0). It is in progress, so this page shows nothing from it. It shows what I studied on the same theme on my own: how many mobile robots a factory aisle can take before it jams, and, more briefly, how far to trust the numbers of a plant dashboard and of a visual inspection gate.
In three lines
- Problem
- The class project on the Industry 4.0 smart factory (Usine 4.0) is in progress, so there is nothing to show from it yet. On the same theme I could study one question alone: how many autonomous mobile robots can a factory aisle take before it jams?
- What I built
- On my own, not for the class project: amr-traffic-lab, a seeded simulation study with a new grid A*, a time axis, a reservation table and Conflict-Based Search, on three hand-drawn factory layouts, with a safety check that recounts conflicts at every tick.
- Result
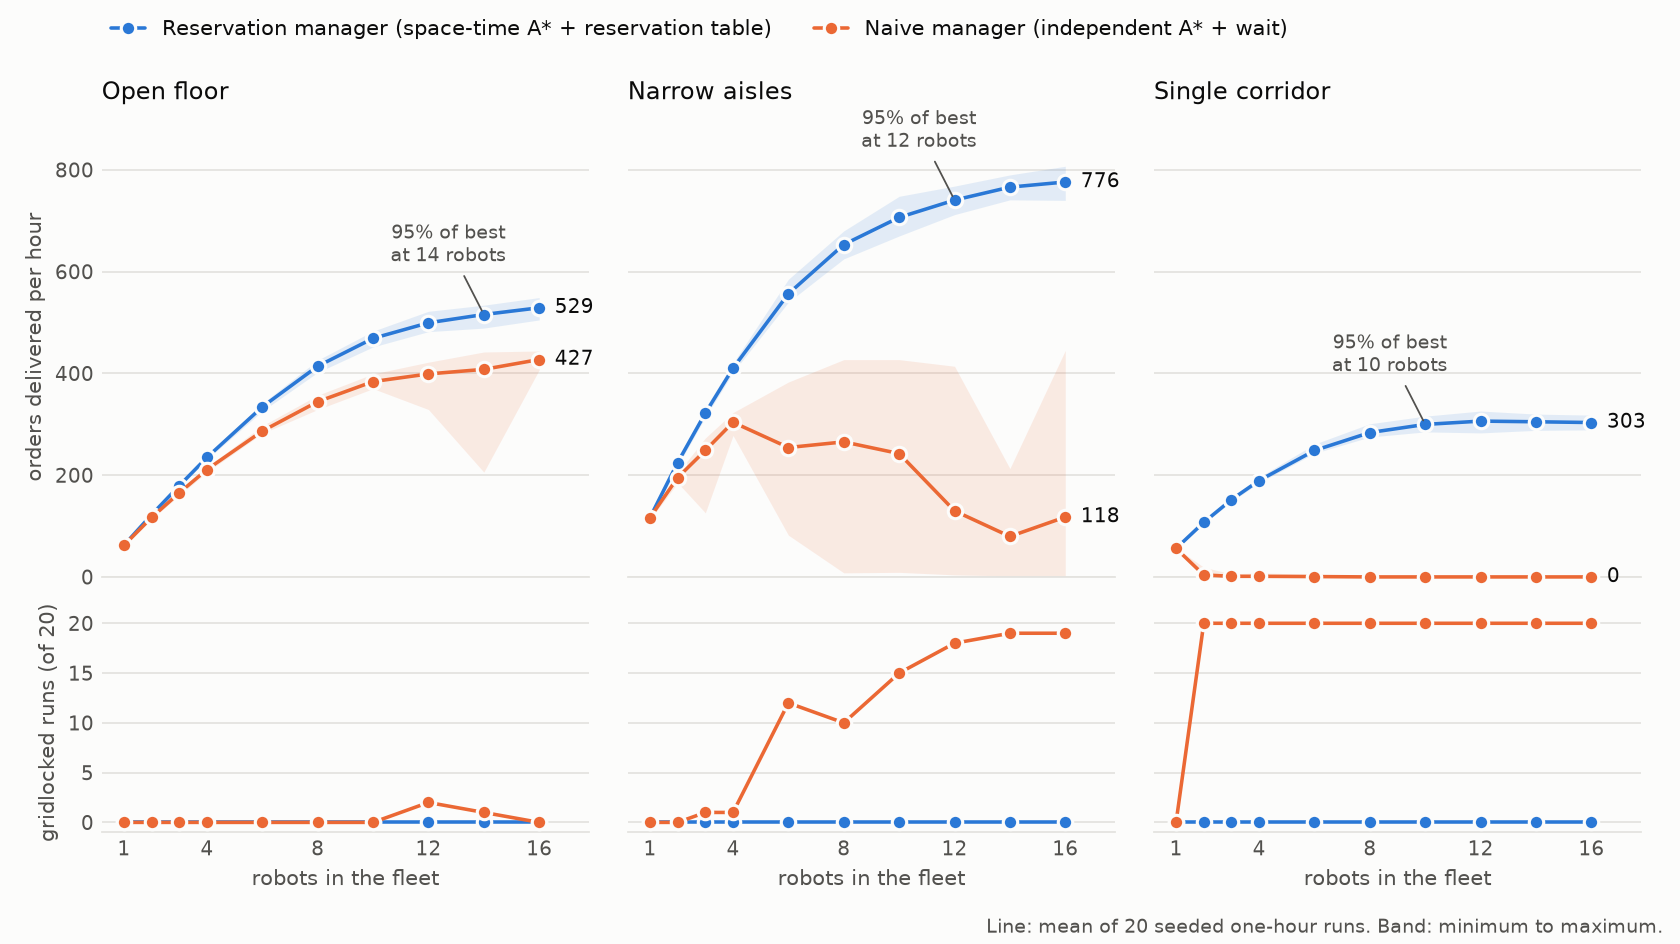
- Of the personal study, not of the class project: the reservation manager never gridlocked (0 of 600 one-hour runs). On the open floor it delivers 24% more orders per hour than the naive manager with 16 robots, and no collision occurred in 3,473,858 simulated ticks.
Context
The class project
This year, 2026 to 2027, my class runs a final-year team project on the Industry 4.0 smart factory (Usine 4.0), one of the key target sectors of the SRI programme. It is in progress.
That is all this page states about it. No partner, platform, robot or result is claimed.
What I studied on my own
The theme raised a question that my AIST work had left open. There I wrote a single-robot A* planner on an occupancy grid, and prepared a ROS 2 interface for Kachaka, a mobile robot that docks under a shelf and carries it. One robot on an empty map never meets the first question that an Industry 4.0 smart factory asks about a fleet: what happens when a dozen of them share one aisle?
amr-traffic-lab is my answer, as a personal side project built in October 2026 with AI assistance, independent of the class project. Two shorter personal studies on the same theme sit next to it in the results below.
What I built
What the study contains
The floor is a text map turned into a 4-connected grid of aisles, pick stations, drop stations and chargers. One cell is 1 m and one tick is 1 s. I wrote a new grid A* for it (not the AIST planner), then gave it a time axis, a reservation table and Conflict-Based Search.
Two traffic managers drive the same seeded orders. The naive one follows its own shortest path, yields when the cell ahead is taken and replans after a random back-off. The reservation manager plans each trip against a table of every committed path, so vertex and swap conflicts are excluded at planning time, and the oldest unfinished trip never waits: on a well-formed layout the fleet cannot gridlock.
Conflict-Based Search, for a fixed set of start and goal pairs, minimises the sum of path costs. Its answers are compared with an exhaustive joint-state search that shares no code with it.
One simulated tick
- 01Seeded orderspick to drop, an endless backlog
Every tick, until the hour ends or the fleet gridlocks
- 02Dispatchernearest idle robot, station locks
- 03Traffic managernaive: own A* route, wait, local replan. Reservation: space-time A* against the reservation table
- 04Joint move of the tickone tick is 1 s, one cell is 1 m
- 05Safety checkvertex and swap conflicts, recounted from the positions
- 06Positions at the next tickdeliveries and the gridlock test
Results
Results of the personal study
Everything below, down to the two shorter studies at the end, comes from amr-traffic-lab, my own simulation study. None of it is a result of the class project.
0 / 600
one-hour runs gridlocked with the reservation manager, over three layouts and ten fleet sizes of up to 16 robots, 20 seeds per cell.
427.2→528.9orders/h
Open floor, 16 robots: orders delivered per hour with the naive manager, then with the reservation manager (24% more). Each is the mean of 20 seeded one-hour runs.
0
vertex or swap conflicts in 3,473,858 simulated ticks (1,200 runs, both managers), counted by a check that shares no code with the planners.
| What was measured | Value | How to read it |
|---|---|---|
| Open floor, 16 robots: orders per hour, naive then reservation | 427.2 → 528.9 | The naive manager rarely jams on the open floor (3 of 200 runs), so this is the fair comparison. In the narrow aisles it jams in 95 of 200 runs. |
| Narrow aisles, 16 robots: gridlocked runs with the naive manager | 19 / 20 | Orders per hour: 117.7 (range 2 to 445) against 776.1 with reservation. |
| Single corridor, 2 robots or more: gridlocked runs with the naive manager | 180 / 180 | Structural, not a surprise: a single lane with no passing place deadlocks any manager that lets robots enter from both ends and never backs up. A lock admitting one direction at a time would be a fairer baseline, and the study does not measure one. |
| Single corridor, reservation manager: orders per hour with 10 robots, then 16 | 299.7 → 303.4 | The only real plateau: the aisle is the limit there, with 27.7% of trip time spent waiting for the lane at 16 robots. On the two other layouts the curve is still rising at 16 robots. |
| Narrow aisles, 8 agents, one-shot planning: instances solved by CBS, then by prioritised planning | 5 / 25 → 17 / 25 | CBS returns the optimal sum of costs but runs out of its 2,000-node budget. Prioritised planning answers in milliseconds (median 2.38 ms against 944 ms). |
| CBS against an exhaustive search on 400 random tiny instances | 334 / 334 | The cost equals the joint-state optimum on every instance CBS finished. Of the 336 solvable instances, 2 ran out of budget. |
Two shorter studies on the same theme
usine40-cell-pipeline sends a simulated production cell through OPC UA, MQTT, PostgreSQL and Grafana and checks the OEE (overall equipment effectiveness) on the dashboard against the simulator’s own event log. visual-quality-gate re-implements PaDiM and PatchCore on five MVTec AD categories and asks what a visual quality gate costs once its threshold has to be chosen.
Both are personal side projects of October 2026, independent of the class project. One result of each:
| What was measured | Value | How to read it |
|---|---|---|
| usine40-cell-pipeline: largest gap between the OEE stored by the pipeline and the OEE of the event log, over 3,600 station-windows of 30 s | 0.000 pp | Nothing is lost or invented between the simulated PLC and the dashboard; it does not show that OEE is the right KPI. A 60 s broker outage at QoS 0 leaves 45 of 240 windows with a wrong OEE. |
| visual-quality-gate: good parts refused by PatchCore WR50-10% when the threshold, set from held-out good parts, aims at 5% | 43 / 408 (10.5%) | Over 3 seeds, 2.1 times the target, while 85 of 1,353 defective parts (6.3%) still get through. |
What failed or is unfinished
0 / 25
one-shot instances of the narrow aisles with 12 agents that Conflict-Based Search solved within its 2,000-node budget. Prioritised planning solved 3 of 25.
The class project is not finished. It is in progress, so nothing from it is shown, measured or claimed on this page.
The corridor result is structural. The naive manager never reverses, and a single lane has no passing place, so its corridor result overstates what reservations add over a lock that admits one direction at a time. The open floor and the narrow aisles are the fairer comparisons.
CBS does not scale here. It is plain Conflict-Based Search with a node budget and none of the improvements that make modern solvers fast, and it cannot prove that an instance is unsolvable. It is a reference for small instances only.
A grid world. Moves take one tick on a 4-connected grid: no acceleration, turning time, robot footprint or localisation error. Reserved paths are executed perfectly, whereas a real fleet needs margins or replanning when a robot is late.
Endless demand, no batteries, no machines. Chargers are parking bays, stations are always ready and orders are an endless backlog. The study measures capacity, not the waiting time of an order in a queue.
Three hand-drawn layouts, fleets up to 16. On the open floor and the narrow aisles the best fleet is a lower bound, since the curve is still rising at 16 robots, the most the chargers can park. One-way aisles, the usual engineering fix, are not studied.
The two shorter studies are small. usine40-cell-pipeline runs a simulated cell, and a zero OEE error shows that nothing is lost or invented on the way, not that OEE is the right KPI. visual-quality-gate covers five of the fifteen MVTec AD categories, and its largest PatchCore memory bank (WR50-10%) refused good parts at about twice the target rate.
Credits
amr-traffic-lab is a personal side project written in October 2026 with AI assistance: its commits carry a Co-Authored-By trailer. Every number on this page is regenerated by a committed script, and a second script checks the README against the results.
usine40-cell-pipeline and visual-quality-gate are personal side projects of October 2026 too, written with AI assistance and committed with a Co-Authored-By trailer; their numbers are regenerated by committed scripts.
The grid A* of the study is new code, not the planner of the AIST internship.
The methods come from the literature: space-time A* with a reservation table (Silver, 2005), Conflict-Based Search (Sharon, Stern, Felner and Sturtevant, 2015), and the lifelong, well-formed setting (Ma, Li, Kumar and Koenig, 2017; Čáp, Vokřínek and Kleiner, 2015).
Links
- amr-traffic-lab: the simulation study (repository)
- The same study on the lab page, with its clip
- usine40-cell-pipeline: the simulated cell, from OPC UA to Grafana (repository)
- visual-quality-gate: PaDiM and PatchCore as a quality gate (repository)
- nav_3dgs_pano: the single-robot A* planner of the AIST internship
- KachakaNavigation: the ROS 2 interface prepared for the Kachaka robot